Improved production efficiency and a larger cattle inventory are expected to increase China's raw milk production by four percent, to over 42 million metric tons (MMT), in 2023. Strong raw milk production is forecast to support higher whole milk powder (WMP) production. Domestic WMP production will weigh on imports of both WMP and skim milk powder. However, imports of other dairy products such as cheese and butter are expected to rise in 2023 due to the end of zero-COVID restrictions.
EXECUTIVE SUMMARY
The forecasts and revised estimates provided in this report are issued by the FAS China office and are not official USDA data.
Fluid milk: Total milk production in 2023 is forecast over 42 MMT, a 4 percent increase over 2022 from production efficiency gains and a larger cattle inventory. Fluid milk imports in 2023 are expected to slightly exceed 2022 levels, as the consumption recovers but domestic production weighs on imports.
Whole Milk Powder (WMP): WMP production forecast for 2023 is increased to nearly 1.8 MMT as excess raw milk is processed into WMP. WMP imports are reduced to 600 thousand MT (TMT) as some food processors increase usage of domestically produced WMP.
Skim Milk Powder (SMP): In 2023, SMP production is forecast at 25 TMT, but imports are reduced to 330 TMT similar to 2022 due to higher domestic WMP production. WMP and SMP are considered interchangeable ingredients for certain products.
Cheese: Domestic cheese production remains minimal but is expected to increase to 25 TMT on lower milk prices. In 2023, cheese imports are forecast at 150 TMT higher than 2022 rates as cheese consumption in the hotel, restaurant, and institutional (HRI) sector rebounds.
Butter: The butter imports in 2023 are forecast higher at 140 TMT as domestic demand rebounds following the end of COVID-19 restrictions. However, high import prices could weigh on imports.
Policy: At the end of 2022, the People's Republic of China (PRC) ended its COVID-19 testing and disinfection measures on imported cold chain products. This is expected to improve importation and distribution of imported dairy products.
FLUID MILK
CONSUMPTION
Raw milk consumption is estimated to exceed 43 MMT in 2023, with growth in fluid and industrial use. Fluid use is expected to rise mainly due to consumption of ultra-high temperature (UHT) milk products, which account for most of the fluid milk consumed in China. Industry data showed growth of liquid milk, with consumption growth in UHT and fluid milk products requiring refrigeration. The uptick in refrigerated fluid milk consumption is an indicator of a gradual rebound in consumption following the end of COVID-19 restrictions.
Production of refrigerated milk products, such as pasteurized and extended shelf-life milk, is also expected to grow in 2023. This is a niche market with a minimal share of the fluid milk market. These products provide an opportunity for local niche producers to expand usage of domestically produced fresh raw milk. However, this industry also faces challenges. Raw milk production is concentrated in Northern China while consumption occurs mostly in southern and eastern China. Most of the new dairy farms are in Northern China - creating a disconnect between producing and consuming regions.
In 2023, factory usage is expected to show strong growth as increased raw milk production drives processors to convert raw milk into WMP.
TRADE
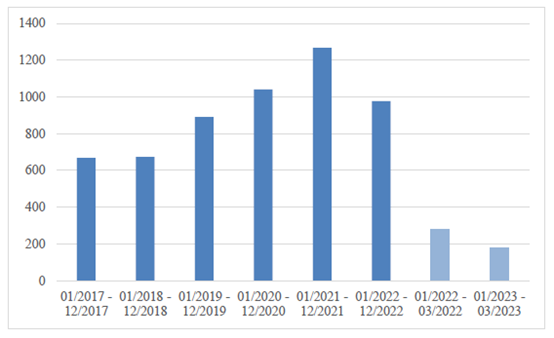
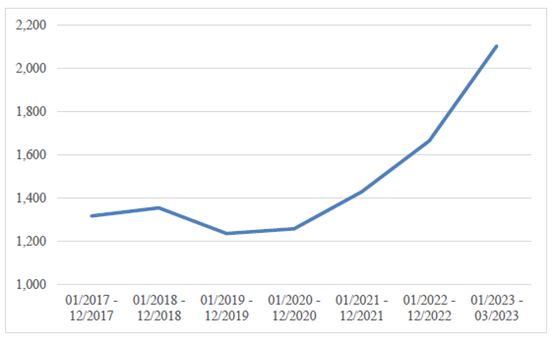
Forecast fluid milk imports are reduced to 1 MMT. Despite the gradual recovery in consumption of fluid milk products imports will be lower due to by increased domestic production, lower domestic milk prices and high fluid mill import prices. In the first quarter of 2023, imports of fluid milk products declined by nearly 35 percent, by volume (see CHART 1). Average prices, based on Chinese import data, rose by 34 percent (see CHART 2).
CHART 1. China: Imports of Fluid Milk (Unit: 1,000 MT)
Source: Trade Data Monitor
CHART 2: China: Imported Fluid Milk Prices (Unit: USD/MT)
Source: Trade Data Monitor
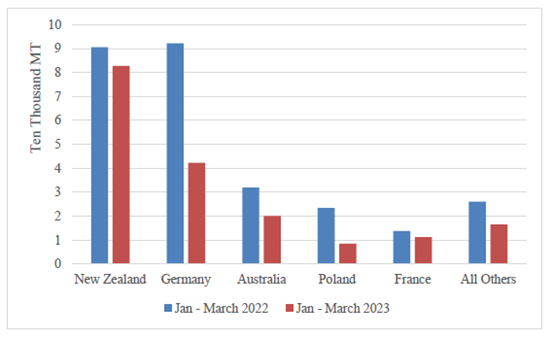
In Q1 2023, fluid milk imports continue to be dominated by New Zealand. China's top five suppliers accounted for over 90 percent of total import volume (see CHART 3) all declined during this period.
CHART 3. China: Imports of Fluid Milk in Q1 2023 (by Origin)
Source: Trade Data Monitor
WHOLE MILK POWDER
CONSUMPTION
In 2023, WMP consumption is expected to reach 1.74 MMT. In Q1 2023, usage of WMP in the bakery sector is gradually recovering. With larger domestic inventories of WMP, food processors are expected to substitute domestically produced WMP for imported WMP, dependent on product specifications.
TRADE
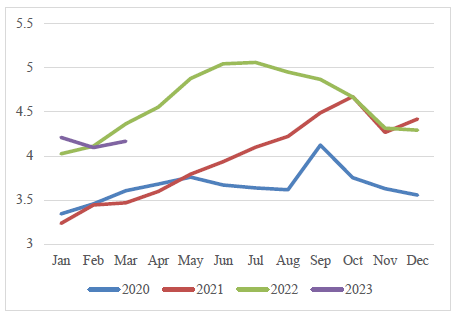
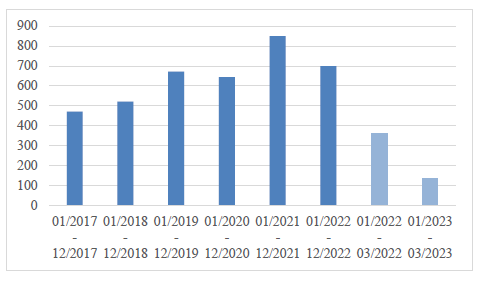
Imported WMP is perceived as a higher quality product with longer shelf life compared to domestically produced WMP. In 2023, importers note that international logistics and customs clearance returned to normal. However, WMP imports forecast in 2023 is reduced to 600 TMT on relatively strong imported WMP prices (see CHART 4) and as production of domestically produced WMP expands. For these reasons, the WMP import volume is expected to decline in 2023 (CHART 5).
New Zealand remains the dominant supplier of WMP, accounting for over 90 percent of imports. New Zealand is followed by Australia.
CHART 4: China: Imported WMP Prices (Unit: USD/MT)
Source: Trade Data Monitor
CHART 5. China: Imports of WMP (Unit: 1,000 MT)
Source: Trade Data Monitor
China's Imports of New Zealand WMP Decline
In December 2022, GACC announced that New Zealand milk powder products in transit had almost exhausted the preferential tariff quotas for 2023. This, combined with the high supply of domestic produced WMP appears to have caused WMP imports from New Zealand to decline over 60 percent in the first quarter.
The 2008 Free Trade Agreement between China and New Zealand gradually reduces tariffs on dairy products imported by China from New Zealand to zero by 2019. However, special safeguard measures have been adopted for milk, milk powder, butter, and cheese. Once the import volume exceeds the import trigger level, the agreed tariff rate no longer applies, but the rate snaps back to the most-favored-nation tariff. The applicable period for special safeguard measures for milk, butter and cheese products is from 2009 to 2021, and the applicable period of special safeguard measures for milk powder is from 2009 to 2023. Milk powder includes WMP and SMP. The HS Codes include: 04021000, 04022100, 04022900, and 04029100.
SKIM MILK POWDER
CONSUMPTION
China's SMP consumption forecast for 2023 is revised down to 353 TMT, similar to 2022. WMP and SMP are often interchangeable in food processing - except for use in low fat or nonfat dairy beverage and processed food. The declining price of domestic WMP this year is expected to encourage food processors to use WMP.
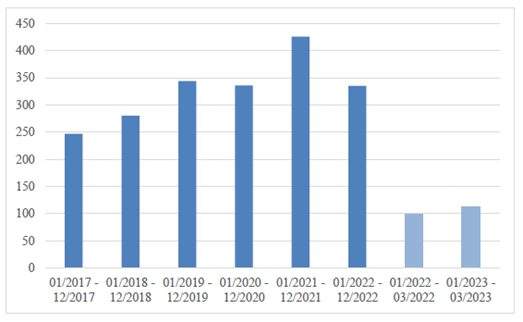
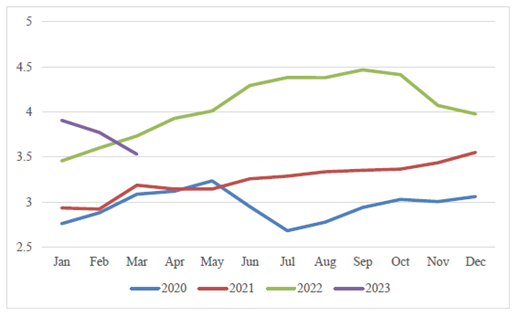
China's SMP supply is dominated by imported products. In the first quarter of 2023, as imported SMP prices declined (see TRADE Section below, CHART 6 and CHART 7) consumption increased over the same period of last year.
TRADE
SMP imports forecast in 2023 is reduced to 330 TMT, similar to 2022. Domestic SMP production remains minimal. Domestic production of WMP (at times interchangeable with SMP) is expected to reduce SMP imports. In Q1 2023, the declining price of imported SMP (see CHART 7) led to increased imports.
CHART 6. China: Imports of SMP (Unit: 1,000 MT)
Source: Trade Data Monitor
CHART 7: China: Imported SMP Prices (Unit: USD/MT)
Source: Trade Data Monitor
New Zealand continues to dominate the market for SMP imports, accounting for more than half China's SMP imports, followed by Australia and the United States.
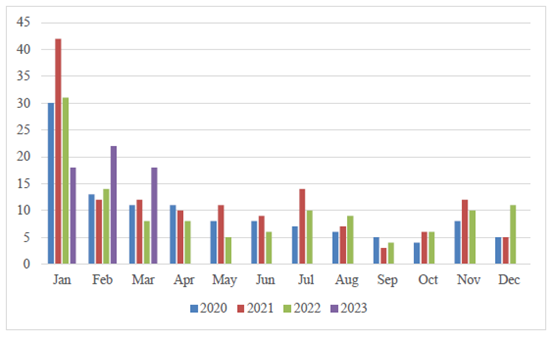
CHART 8. China: Monthly Imports of SMP from New Zealand (Unit: 1,000 MT)
Source: Trade Data Monitor
As noted in the WMP trade section, New Zealand receives preferential tariffs up to a certain limit for milk powder products and 2023 is the last year for special safeguard measures on milk powder. Previously, importers had rushed to secure allocations of the safeguard quota at the beginning of the year. This caused imports to concentrate in January.
In December 2022, GACC announced that New Zealand milk powder products in transit had almost exhausted the preferential tariff quotas for 2023. For this reason, importers are not incentivized to import more SMP from New Zealand in January but are expected to import SMP at a relatively consistent level throughout the year (see CHART 8).
CHEESE
CONSUMPTION
The cheese consumption forecast for 2023 is increased to 175 TMT due to growth in domestic supply. The gradual economic recovery is expected to boost demand for cheese products. E-commerce and community group buying are expected to remain popular and convenient. Cheese consumption is expected to remain concentrated in affluent cities in the southern and eastern provinces where high-income consumers are less affected by economic pressures.
However, high prices for imported cheese could curb the growth of cheese consumption in 2023 as the economy is only gradually recovering. For example, in Q1 2023, some off-line retailers such as supermarkets reported lower cheese sales.
TRADE
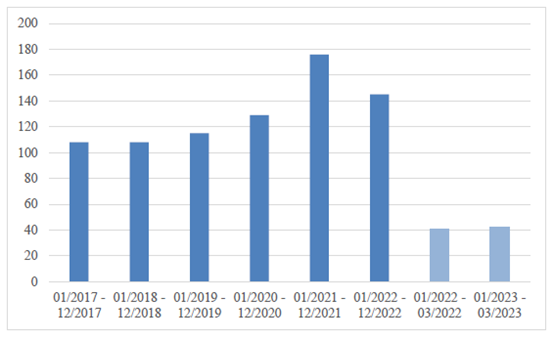
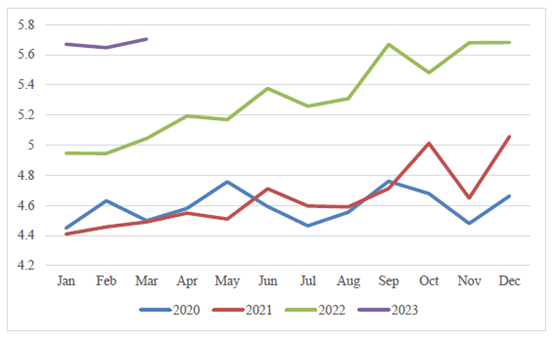
Cheese imports in 2023 are forecast at 150 TMT. Recovering cheese demand from HRI will support increased imports. Additionally, the PRC’s removal of COVID-19 testing and disinfection requirements for imported cold-chain products is expected to support the improved distribution of imported cheese products. In Q1 2023, cheese imports grew slightly (see CHART 9) despite higher import prices (see CHART 10) - indicating strong consumer demand for imported cheese products.
CHART 9. China: Imports of Cheese (Unit: 1,000 MT)
Source: Trade Data Monitor
New Zealand dominates the market, accounting for nearly 70 percent of all imports. Other major suppliers, including Australia, Italy, and the United States, exported less in Q1 2023 than in Q1 2022.
CHART 10: China: Imported Cheese Prices (Unit: USD/MT)
Source: Trade Data Monitor
POLICY
National Food Safety Standard - Processed Cheese and Cheese Products GB 25192-2022 came into effect on December 30, 2022. The new national standard divides processed cheese products into processed cheese and processed cheese products according to the proportion of raw cheese ingredients. The raw cheese usage ratio of processed cheese is adjusted from more than 15 percent to more than 50 percent, and products with a cheese ratio between 15 percent and 50 percent can be called "cheese products". The new standard is expected to improve the overall quality of the processed cheese production in China. Cheese imports can also benefit from this new standard as more raw cheese is required to produced processed cheese.
BUTTER
CONSUMPTION
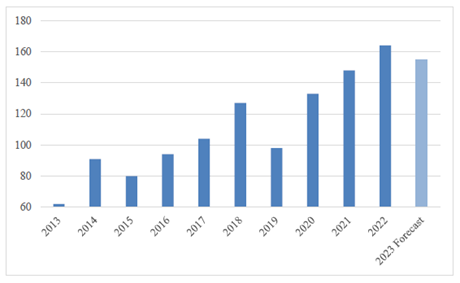
Imported butter dominates China's butter consumption. In 2023, butter consumption is expected to decline due to high import prices. Processors may choose to use plant based (or artificial) butter to manage price increases. China's domestic butter production is not expected to mitigate the decline in overall consumption. In 2023, demand from bakeries, the food processing sector, and retail is expected to lessen overall consumption decline due to high import prices. Despite the decline, butter consumption in 2023 remains historically high (see CHART 11).
CHART 11. China: 10-Year Butter Consumption (Unit: 1,000 MT)
Source: FAS China Domestic Production Estimates and China Customs Data
TRADE
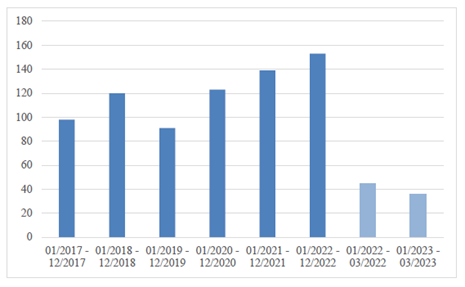
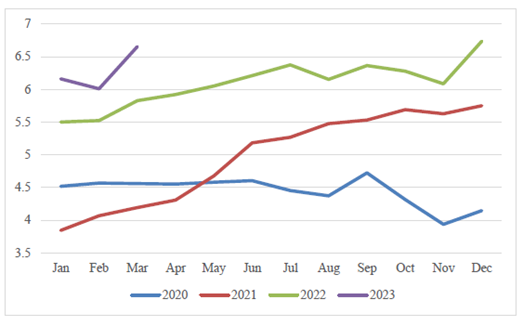
Forecast 2023 butter imports are expected to reach 140 TMT with gradual recovery in demand. They will remain below 2022 rates due to high global butter prices. In 2023 Q1, the import price and lower import volume remained in line with our forecast (see CHART 12 & 13).
China's imports of butter are expected to continue to be dominated by New Zealand which, in the first quarter of 2023, accounted for over 90 percent of all butter imports by China.
CHART 12. China: Imports of Butter (Unit: 1,000 MT)
Source: Trade Data Monitor
CHART 13: China: Imported Butter Prices (Unit: USD/MT)
Source: Trade Data Monitor
WHEY AND WHEY PRODUCTS
Whey and whey related products showed different trends in early 2023. In the first quarter of 2023, imports of whey and modified whey products (HS040410) grew by over 57 percent, while the average import price (in U.S. $ per metric ton) declined by 6 percent. Imports of whey related products (HS350220) products declined by nearly 15 percent, while the average import price increased by 23 percent.
Importers of U.S. whey and whey related products are eligible for tariff exclusions under the Section 301 exclusion process.
Source: USDA
Note: This article is compiled by Antion, please indicate our source if reprint it.